If you’re like me, you’re in love with infographics because they take spreadsheets, lists, tables and large amounts of data and make them meaningful, useful and sometimes – when done right – beautiful. Case and point are two interactive infographics created by Casey Trees that are a leaf peepers dream.
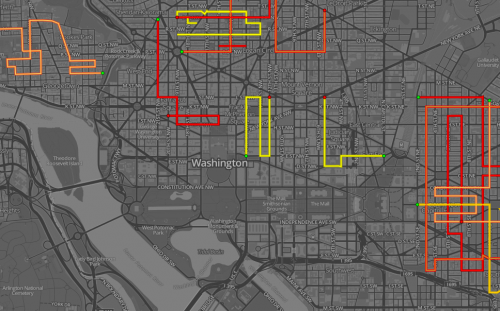
The first infographic, which for me is the more useful of the two, suggests DC routes leaf peepers should take for maximum fall color viewing. On hover over, users are given the route’s length, walk or drive recommendations, number of colored trees along the route, types of trees along the route and expected level of color users will see.
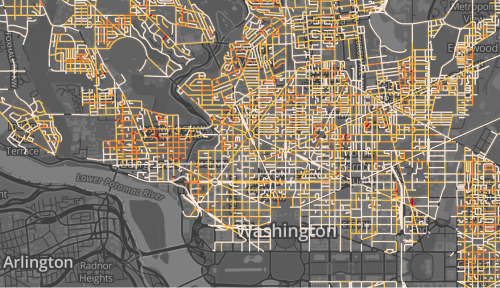
The second infographic takes a mixture of trees (selected from a DDOT and Casey Tree database) known to have good fall color and spatially joins them with a DC roadmap. As Fall progresses, the color of the map changes with the deeper red indicating deeper fall color density.

I really had fun playing with both infographics; zooming in on different neighborhoods to see what the fall foliage status was and thinking about where I’d like to take a long fall stroll to enjoy the leaves, grab some lunch, peruse shops and have a great fall day.

