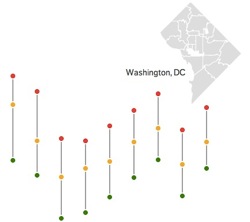
Real estate site Trulia has released a new fun tool to look at zip code by zip code break downs of DC Real Estate including some spiffy sorting options that show that Capitol Hill has the highest “lowest” price, while Georgetown has the highest “median” price. Georgetown also carries the largest disparity, with an 8.7x factor between high and low end. 20001 (containing Shaw) has the shallowest magnification factor at 2.8.
Now, there are problems with looking at real estate trends based just on zip codes instead of actual neighborhood boundaries, but that’s a harder database query, that’s for sure. As someone who lives in 20018, but whose neighborhood is mostly comprised of 20017, I suspect that there’s some better breakouts of this stuff available somehow.


If the data includes census tracts, the easiest way to do this for a neighborhood would be to eyeball the map of census tracts and select for the ones that most closely match the neighborhood boundary you want.
In DC the city records assessment neighborhoods and sub-neighborhoods with hard boundaries, but they don’t always match what you’d think of as a neighborhood (my favorite examples of these are Old City #1 and Old City #2). You could use those, but since they don’t always align with commonly understood boundaries, they’re not very useful.
The last, hardest, and slowest option is to geocode neighborhood boundaries as polygons, and then use a plugin on your database to determine what listings actually fit within that polygon. This is rarely worth the effort, because then you get people arguing about Bloomingdale and Eckington and how you’ve drawn your borders wrong.
Yes, I have done this sort of thing before.